
Aleksandra Khmelevskaya, Raphael Micheroli, Caroline Ospelt — University Hospital of Zurich
Selecting the method
Our first task as part of the MDR-RA project was to carry out spatial transcriptomics on existing MDR-RA samples. Spatial transcriptomics makes it possible to measure the expression of thousands of genes on a single tissue section, enabling us to identify the different cell types within the tissue and determine their state of activation. This allows us to determine where activated cells are located within the synovial tissue and which cells they interact with.
However, as there is not yet a perfect technique for this, we opted for two complementary approaches. The first approach is called Xenium and allows the tissue to be examined at single-cell resolution; however, only a limited number of genes can be measured. The standard panel comprises 5,000 genes. That sounds like a lot, but it must be kept in mind that the panel was not designed for the analysis of synovial tissue, meaning that some of the genes in the panel are not expressed by the cells in the synovium. Furthermore, the synovium is a tissue containing many different cell types, such as endothelial cells, fibroblasts and various immune cells, and each of these main cell types has numerous subtypes, such as arterial, venous and lymphatic small vessels, as well as various differentiation and activation states of the immune cells. In synovial fibroblasts alone, at least four main subtypes have been characterised. To ensure that we can characterise all the subtypes we consider important in the RA synovium, we have added a further 50 genes that were specifically selected to define the various subpopulations in the RA synovium.
However, as this is an exploratory approach, and we do not want to miss anything, we decided to use Visium as our second approach. Visium has a lower resolution, so you cannot distinguish individual cells from one another precisely, but rather see small cell niches. The advantage is that you can measure 20,000 genes within these niches. So, whilst we probably cannot say exactly which cell type produces what with this approach, we can still detect activation signals and see where in the tissue they are located.
Selecting the tissues
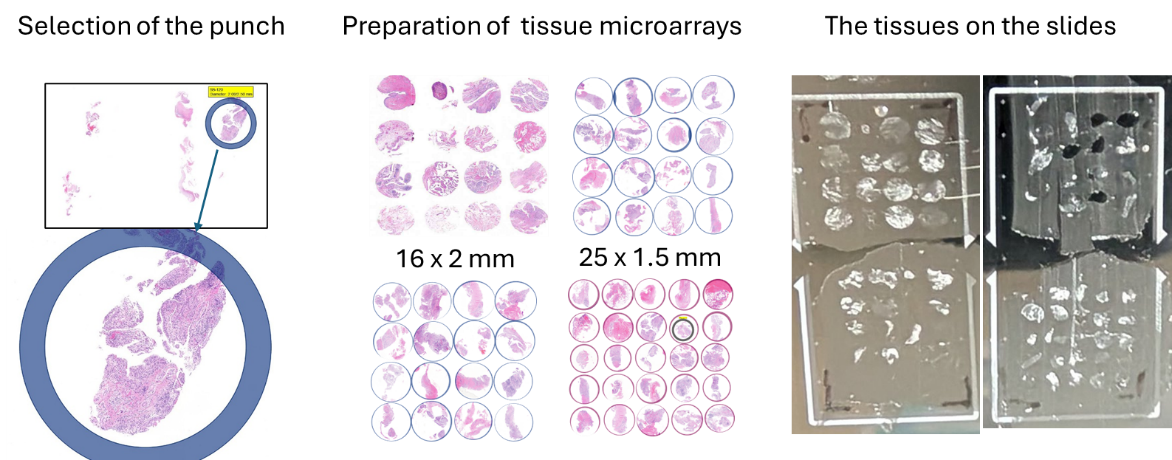
We then had to select the tissue samples we wished to examine. As tissue samples from synovial biopsies are very small and both procedures are very costly, we decided to prepare tissue microarrays from selected biopsies. In this technique, representative sections with a diameter of 2 mm or 1.5 mm are selected from the paraffin-embedded tissue; these contain high-quality synovial tissue as well as all the structures we wish to analyse (blood vessels, immune infiltrates, lining layer). The sections are then punched out of the paraffin block and arranged close together in a new block. This allows us to measure multiple sections and patients on a single slide, thereby making optimal use of space.
Technically, this is quite a challenge, but the Department of Pathology at the University Hospital of Zurich has many years of experience with this technique and produced 4 tissue microarrays containing 73 synovial tissue sections for us. We have used multiple tissue sections from some patients to ensure we obtain representative data and to minimise the risk of losing a patient sample should the workflow encounter technical difficulties. Sometimes the tissue sections are too small or are not precisely in a single layer, meaning that good sections cannot be obtained from all tissues.
Measuring gene expression in the tissues
Finally, we cut out 10-µm sections from our tissue microarrays and placed them in the designated measurement areas of the Xenium slide. We then transferred some of the tissue samples measured in the Xenium to the special Visium slides. As the measurement area of the Visium is smaller than that of the Xenium, we were unable to transfer them on a one-to-one basis; instead, we had to select some tissues for direct transfer, whilst for others we used a follow-up section for measurement on the Visium slide. This process was carried out for us by Functional Genomics Center Zurich, the University of Zurich's core facility.
Ultimately, we succeeded in generating data from 16 MDR-RA patients using the Xenium and from 10 of these MDR-RA patients using the Visium. As controls, we also measured synovial tissue from patients with non-inflammatory, traumatic knee injuries, RA patients who were not classified as MDR-RA, and patients with other chronic inflammatory joint diseases (psoriatic arthritis, undifferentiated arthritis).
First results
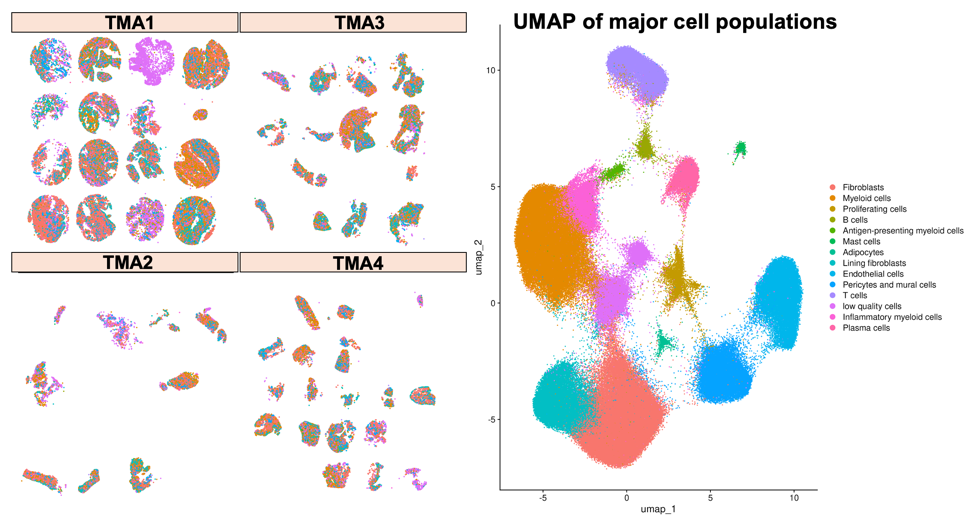
Using the Xenium platform, we successfully characterised a total of 211,119 individual cells across our synovial tissue sections. These cells fell into 13 distinct populations, ranging from the most abundant — fibroblasts (52,776 cells) and myeloid cells (50,857 cells) — to rarer populations such as mast cells (1,219 cells) and adipocytes (756 cells).
| Cell type | Count |
|---|---|
| Fibroblasts | 52,776 |
| Myeloid cells | 50,857 |
| Lining fibroblasts | 23,213 |
| Endothelial cells | 21,653 |
| Pericytes and mural cells | 19,891 |
| T cells | 15,943 |
| Inflammatory myeloid cells | 9,105 |
| Plasma cells | 7,506 |
| Proliferating cells | 4,183 |
| B cells | 2,655 |
| Antigen-presenting myeloid cells | 1,362 |
| Mast cells | 1,219 |
| Adipocytes | 756 |
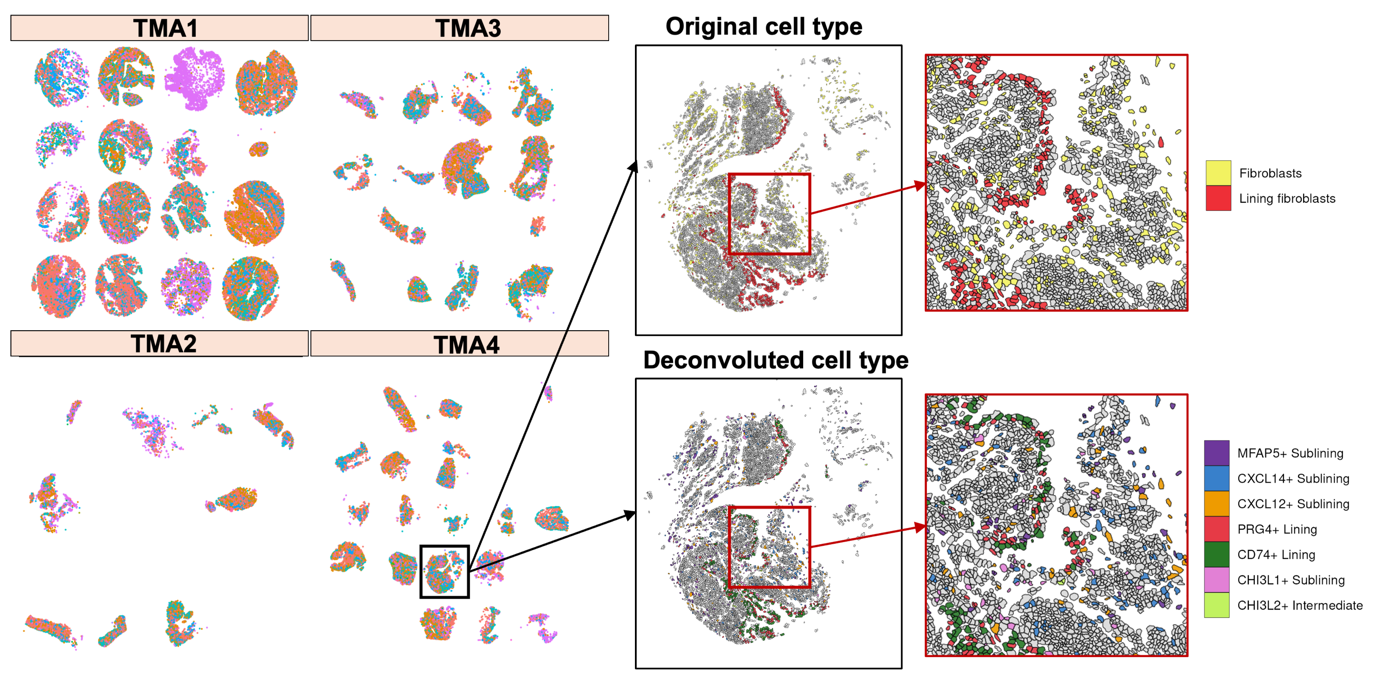
To assign these broad categories to more precise cell types, we applied two computational deconvolution methods — RCTD and InSituType — using a previously published single-cell RNA sequencing atlas of synovial tissue as a reference. Deconvolution works by comparing the gene expression profile of each detected cell with the profiles of known cell types in the atlas, thereby allowing us to identify not just the main cell class but also the specific subpopulation a cell belongs to. For example, rather than classifying a cell simply as a "Fibroblast", this approach allowed us to distinguish between PRG4+ lining fibroblasts, CXCL12+ sublining fibroblasts, and other fibroblast subpopulations that may behave very differently in the context of inflammation.
In parallel, the Visium measurements provided a complementary view of the tissue at the level of small cell clusters. Across our Visium samples, gene expression was detected for approximately 50,000 genes, enabling us to capture a broad picture of the transcriptional landscape — including activation signals that may be present even at low levels or in rare cell populations that are difficult to detect at single-cell resolution.
Together, these first results demonstrate that our spatial transcriptomics workflow is working as intended and is capable of capturing the full cellular complexity of the RA synovium. Linking cell type identity, activation state, and spatial location across both platforms will allow us to address our central question of where and how treatment-resistant inflammation is sustained in MDR-RA.

